
While Lime was the active bikeshare system in Ithaca from 2018 to 2020, Bike Walk Tompkins collaborated with the City of Ithaca and other local partners in the shared oversight of the bikeshare system in Ithaca. Learn how people in Tompkins County used the Lime system in our annual reports based on trip data provided by Lime and user surveys.
The 2019 report includes street-by-street estimated volumes of Lime rides based on trip data.
2019 Lime Trip Data Report
With the help of Waishan Qiu, PhD candidate in Regional Science at Cornell University, Bike Walk Tompkins was able to take a deeper dive into the trip data that was provided by Lime for its 2019 full year of continuous operation in Ithaca. In addition to standard trip data such as ridership over time and by neighborhood, data that is available for 2019 include street-by-street estimates of bikeshare use, seasonal impacts on bikeshare use, and the interplay between bikeshare and transit ridership.
Key Findings
There were 100,300 valid bike trips taken on Lime bikes in 2019, with month-by-month ridership highest in the warmer months and peaking in September.
The median duration of bike trips was 7 minutes and the average was 12 minutes, suggesting that the majority of trips were for non-recreational purposes.
Lime bike activity in and around campus, student residences, and recreational areas show clear seasonal fluctuation, and rides on East Hill exceed those in the Flats during the fall semester despite Cornell’s policy on dockless bikeshare.
In the Flats, the main axis of bikeshare activity is from Fall Creek–Downtown, while on East Hill, the main axis is North Campus–Central Campus–Collegetown.
Most commonly used street corridors for bikeshare in Ithaca include East and College Ave, Cayuga St, Stewart and Buffalo St , State St, Tioga St, and Plain St.
There are strong signals that higher bikeshare use is correlated to peak times at major TCAT bus stations, and we conservatively estimate that 4300+ Lime trips were used for first-mile/last-mile connections to transit in 2019.
2019 Lime User Survey Analysis
Due to a lack of user data provided through Lime, Bike Walk Tompkins and the Ithaca-Tompkins County Transportation Council developed a web-based survey to collect demographic and bike use data from bikeshare riders. The survey was shared by Lime with its users and also on social media in the summer of 2019. In the summer of 2020, Bike Walk Tompkins intern Xiaojun Ge analyzed the data that was collected and created a report as well as an executive summary.
Key Findings
Community members of all ages, genders, ethnicities, incomes, and educational backgrounds used Lime. People of color, students, and people from lower-income households have a higher tendency to be Lime bike riders.
Lime changed people's use of other modes of transportation; the most commonly reported changes were 37% of riders walked less often, 28% drove alone less often, and 24% took taxis or Ubers less often thanks to bikeshare.
The overwhelming majority of riders agreed that Lime is easily accessible, convenient, easy to use, well-maintained, and good for the community, while non-riders disagreed most with the parking and community benefit of Lime.
Nearly half of the riders have very positive impressions about the Lime bike system, but a significant number of riders also think the cost of using Lime-E bikes is too high. Also, complaints about safety and parking were more likely to be brought about by non-riders than riders.
2018 Lime Trip Data REPORT
In the spring of 2019, Bike Walk Tompkins analyzed trip data provided by Lime to understand where people in and around Ithaca were using the bikeshare system and for what types of trips. This analysis contained no identifiable user data and a full report was released in June 2019. In the summer of 2020, Bike Walk Tompkins intern Xiaojun Ge developed an executive summary of the full report, with graphic depictions and highlights from the data.
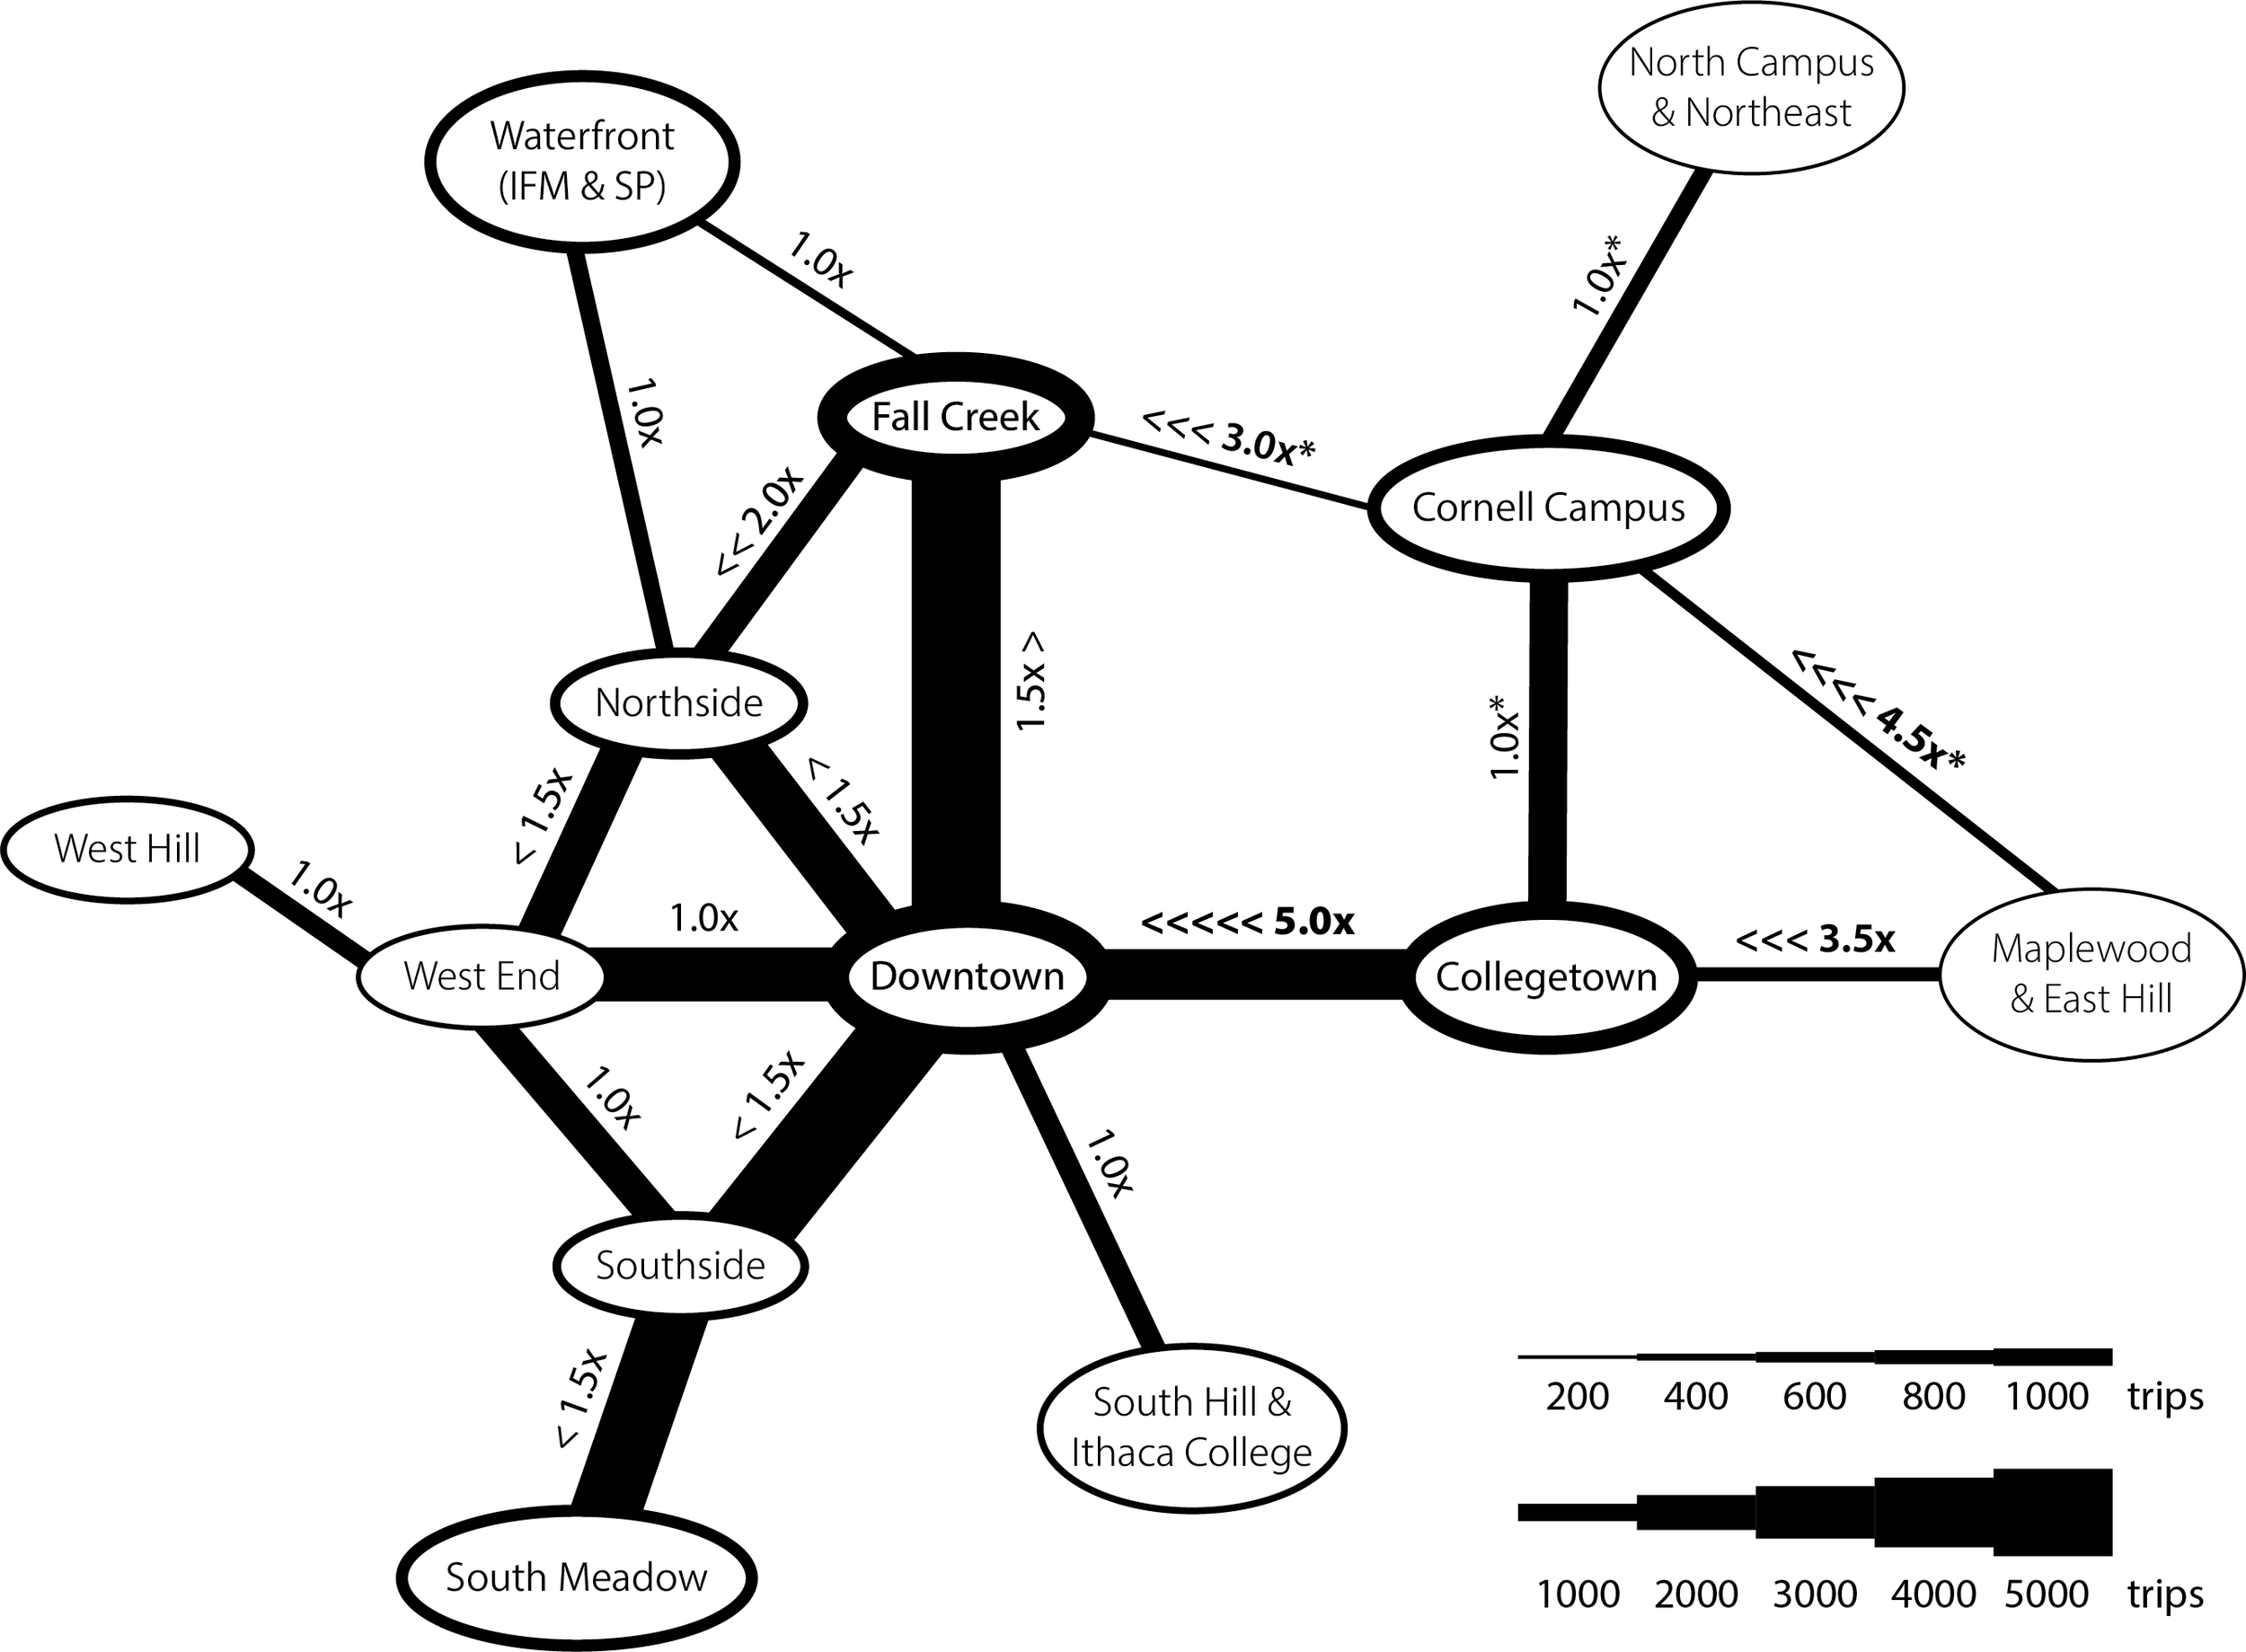
The flow of bikes was highest between Fall Creek–Downtown–Southside–South Meadow during the fall of 2018.
Key Findings
There were 77,606 valid bike trips taken on Lime bikes in 2018; ridership is highest during the warmer months and peaks when students return in the fall.
In the fall and winter, the median duration for pedal bikes was 9 minutes, and for Lime-E bikes it was 7 minutes; and e-bikes were demonstrated to be useful in climbing hills.
Most trips started and ended within the City of Ithaca, and users of the Lime system have visited nearly all streets in the Flats.
The Fall Creek–Downtown–Southside–South Meadow axis carries the highest proportion of Lime rides, and hot spots where people most often ended their trips include transit stations, libraries, grocery stores, parks, and shopping areas.
Neighborhood ORigin-DEstination Chord Diagrams
By grouping where trips started and ended by neighborhood, we get a sense of how people moved in Ithaca using Lime pedal and e-bikes in 2018.
